DERIVED MEASURES X
Mean. This measure represents an arithmetic average of a set of values. It is derived by dividing the sum (or aggregate) of a group of numerical items by the total number of items in that group. For example, mean household earnings is obtained by dividing the aggregate of all earnings reported by individuals with earnings in households by the total number of households with earnings.
Median. This measure represents the middle value (if n is odd) or the average of the two middle values (if n is even) in an ordered list of n data values. The median divides the total frequency distribution into two equal parts: one-half of the cases falling below the median and one half above the median. The median is computed on the basis of the distribution as tabulated, which is sometimes more detailed than the distribution shown in specific census publications and other data products.
Interpolation. Interpolation frequently is used in calculating medians or quartiles based on interval data and in approximating standard errors from tables. Linear interpolation is used to estimate values of a function between two known values.
Percentage. This measure is calculated by taking the number of items in a group possessing a characteristic of interest and dividing by the total number of items in that group and then multiplying by 100.
Rate. This is a measure of occurrences in a given period of time divided by the possible number of occurrences during that period. Rates are sometimes presented as percentages.
ENDNOTES
-
* X
Excerpted from American Community Survey – Subject Definitions
http://www.census.gov/acs/www/Downloads/data_documentation/SubjectDefinitions/2009_ACSSubjectDefinitions.pdf
About the Data
For a detailed analysis
of rural housing conditions download
HAC'S TAKING STOCK Report & Maps

Download Entire Report
Download By Section
National ConditionsRegional Analysis Appendices
Download Maps:
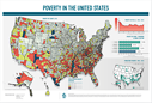
 Poverty in the United States