
DATA LIMITATIONS
Census 2010 Overcount/Undercount VIII
The Census Bureau estimates that among the 300.7 million people who live in housing units, about 94.7 percent were counted correctly, about 3.3 percent were counted erroneously, 1.6 percent provided only a census count and had their demographic characteristics imputed, or statistically inserted, and 0.4 percent needed more extensive imputation after all census follow-up efforts were attempted. Among those erroneously counted, about 84.9 percent were duplicates, while the remainder were incorrectly counted for another reason, such as people who died before Census Day (April 1, 2010), who were born after Census Day or were fictitious census records.
The Census Bureau estimated 16.0 million omissions in the census. Omissions include people missed in the census and people whose census records could not be verified in the post-enumeration survey because they did not answer enough of the demographic characteristic questions in the census. Of the 16.0 million omissions, about 6.0 million were likely counted in the census but couldn't be verified in the post-enumeration survey.
The 2010 Census undercounted renters by 1.1 percent, showing no significant change compared with 2000. Homeowners were overcounted in both the 2000 and 2010 censuses. However, the 2010 Census reduced the net overcount for homeowners from 1.2 percent to 0.6 percent. Renters were more likely to be duplicated than owners and twice as likely to have all of their characteristics imputed.
As with prior censuses, coverage varied by race and Hispanic origin. The 2010 Census overcounted the non-Hispanic white alone population by 0.8 percent, not statistically different from an overcount of 1.1 percent in 2000.
The 2010 Census undercounted 2.1 percent of the black population, which was not statistically different from a 1.8 percent undercount in 2000. In 2010, 1.5 percent of the Hispanic population was undercounted. In 2000, the estimated undercount of 0.7 percent was not statistically different from zero. The difference between the two censuses was also not statistically significant.
The Census Bureau did not measure a statistically significant undercount for the Asian or for the Native Hawaiian and Other Pacific Islander populations in 2010 (at 0.1 percent and 1.3 percent, respectively). These estimates were also not statistically different from the results measured in 2000 (a 0.8 percent overcount and a 2.1 percent undercount, respectively).
Coverage of the American Indian and Alaska Native population varied by geography. American Indians and Alaska Natives living on reservations were undercounted by 4.9 percent, compared with a 0.9 percent overcount in 2000. The net error for American Indians not living on reservations was not statistically different from zero in 2010 or 2000.
Men 18 to 29 and 30 to 49 were undercounted in 2010, while women 30 to 49 were overcounted, a pattern consistent with 2000. The estimated overcount of women 18 to 29 was not statistically significant.
The post-enumeration survey did not measure a statistically significant undercount or overcount in the population or housing units for any state. The survey did not measure a statistically significant undercount or overcount for the population in any counties or places of 100,000 or more. The 2010 Census undercounted housing units, mostly because of an undercount of vacant units. On the other hand, there was no statistically significant undercount or overcount of occupied housing units.
Margin of Error in the American Community Survey. IX
Data from the American Community Survey (ACS) is based on a sample and is subject to sampling variability. Sampling error is the uncertainty associated with an estimate that is based on data gathered from a sample of the population rather than the full population. The American Community Survey (ACS) provides users with measures of sampling error along with each published estimate. To accomplish this, all published ACS estimates are accompanied either by 90 percent margins of error or confidence intervals, both based on ACS direct variance estimates.
The margin of error is most often indicated by plus and minus signs followed by a number value. This value represents the range within which one can assert the population value will be found, according to varying levels of confidence. The margin of error gives nuance to the best guess point estimates by providing a more accurate range of data values. Adding and subtracting the margin of error to a point estimate creates the range, or the confidence interval.
Point estimates use statistical techniques, such as regression models, to infer from sample data what the actual value of the characteristic is in the population. These point estimates can be thought of as a best guess of the population characteristic value, given the available sample survey data information. As with any guess or prediction, estimates are only as reliable as the information they are based on. Estimates such as those presented in the ACS can vary in precision, especially in relationship to the overall sample size. A smaller number of sample observations leads to less accurate estimates, while a larger number of sample observations often provide more accurate estimates.
For more information of accuracy of data from the American Community Survey please consult the Census Bureau publication, ACS Design and Methodology:
http://www.census.gov/acs/www/methodology/methodology_main/
ENDNOTES
- * VIII Excerpted from U.S. Census Bureau, http://content.govdelivery.com/bulletins/gd/USCENSUS-418bf7
-
* IX
Excerpted from American Community Survey,
http://www.census.gov/acs/www/methodology/methodology_main/
About the Data
For a detailed analysis
of rural housing conditions download
HAC'S TAKING STOCK Report & Maps

Download Entire Report
Download By Section
National ConditionsRegional Analysis Appendices
Download Maps:
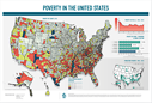 Poverty in the United States