
RURAL DATA PORTAL RELIABILITY INDEX
HAC’s Rural Data Portal presents a reliability index to help users determine the statistical accuracy of data estimates presented from the Census Bureau’s American Community Survey (ACS). The Portal’s reliability index utilizes a coefficient of variation (CV) calculated for each county-level estimate presented from ACS data. The CV is a ratio of an estimate’s standard error to the actual estimate itself
The standard error (SE) of an estimate, as the Census Bureau notes, "provides a quantitative measure of the extent to which an estimate derived from the sample survey can be expected to deviate from the population value." II Stated another way, the SE is a measure of a presented estimate’s precision. Generally, a smaller SE indicates a more precise estimate.
Dividing the standard error by the estimate generates a coefficient of variation (CV), which in turn creates a metric to assess an estimate’s precision or error as a proportion of the estimate. The relative size of estimates is an important reason for using a CV to help determine statistical reliability. Similar to the presentation of standard error, the larger the CV ratio, the less accurate the estimate.
HAC’s Rural Data Portal reliability index is presented below:
| Green | = | High Reliability Estimate – Coefficient of Variation (CV) less than 15 percent |
| Yellow | = | Reliable Estimate – Coefficient of Variation (CV) between 15 percent and 29.9 percent |
| Red | = | Low Reliability Estimate - Coefficient of Variation (CV) 30 percent or higher. Use caution when referring to or presenting this estimate. Please consult the Census Bureau for more information and guidance. |
| Gray | - | Reliability Estimate Not Available |
The choice of an estimate’s reliability, accuracy or precision threshold is not standard and agreed upon. HAC considered three general approaches in developing a reliability indicator -- all of which use a coefficient of variation to evaluate ACS estimates. An ESRI white paper on the American Community Survey suggests using CV threshold standards of 0-12 percent indicating reliable, 12 percent to less than 40 percent medium reliable, and 40 percent and higher low reliability. III The Washington State Office of Financial Managment produced an ACS User Guide that employed the following thresholds: 0 to less than 15 percent as good, 15 percent to less than 30 percent as fair and 30 percent or more as caution. IV A University of Michigan Population Studies Center webpage review of the American Community Survey data quality issues states that the Census Bureau, “recommends that the CV be less than 10." V
ENDNOTES
- * I In the formula the standard error notation is SE and the estimate is X hat.
- * II US. Census Bureau. 2009. Compass for Understanding and Using American Community Survey Data: What Users of Data for Rural Areas Need to Know. US. Census Bureau Published. Paper was accessed 12/15/12 at the following url: http://www.census.gov/acs/www/Downloads/handbooks/ACSRuralAreaHandbook.pdf
- * III 2011. The American Community Survey: An ESRI White Paper. Paper accessed on web 12/15/12 at the following url: http://www.esri.com/library/whitepapers/pdfs/the-american-community-survey.pdf
- * IV Gardner, E., Zhao, Y., & Kimpel, T. (2010). American Community Survey User Guide ACS Publication No 1. Washington State Office of Financial Management. Paper accessed on web 12/15/12 at the following http://www.ofm.wa.gov/pop/acs/userguide/ofm_acs_user_guide.pdf
- * V Population Studies Center: Data Quality Issues with the American Community Survey (ACS): Webpage accessed 12/15/12 at the following url: http://www.psc.isr.umich.edu/dis/acs/aggregator
About the Data
For a detailed analysis
of rural housing conditions download
HAC'S TAKING STOCK Report & Maps

Download Entire Report
Download By Section
National ConditionsRegional Analysis Appendices
Download Maps:
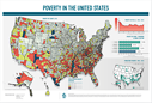 Poverty in the United States